This repository introduces a set of scales for the product categories, Dashboard and Virtual Reality, to the User Experience Questionnaire (UEQ+). The UEQ+ is a standardized questionnaire that provides a set of scales considered to be most important for evaluating the user experience of a product family. We have conducted a quantitative study to determine the most important scales. For this purpose, a procedure that had been used in previous studies to determine the most important User Experience scales for the categories Games and Learning Platforms was reproduced. These product categories were integrated to ensure that the conditions of our study were similar. The results are presented, critically discussed, and compared with previous studies. The derived procedure is assessed for its validity and presented in an open repository. In this repository, we present, based on our study, the most important scales for UEQ+ evaluations for Dashboard and Virtual Reality products.
Most important scales
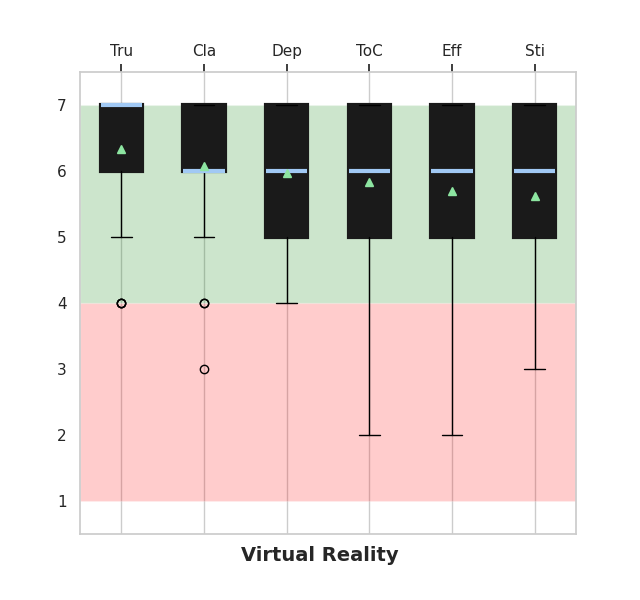
In the following graphics are the top-rated scales for Virtual Reality and Dashboard visualized. These box plots show the highest-ranked scales sorted by their mean (light triangle).
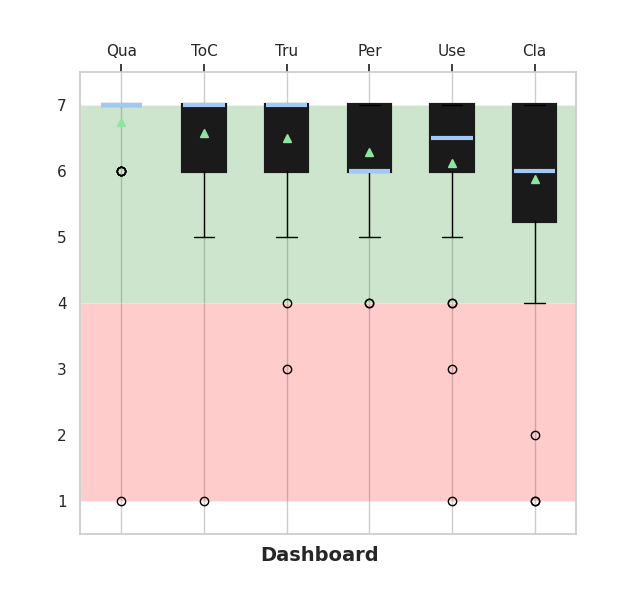
Top Scales Dashboard
- Quality of Content (Qua)
- Trustworthiness of Content (ToC)
- Trust (Tru)
- Perspicuity (Per)
- Usefulness (Use)
- Clarity (Cla)
Top Scales VR
- Trust (Tru)
- Clarity (Cla)
- Dependability (Dep)
- Trustworthiness of Content (ToC)
- Efficiency (Eff)
- Stimulation (Sti)
Methodology & Results
Based on the paper by Winter, Hinderks, Schrepp, and Thomaschewski (2017) (link to paper), we conducted a survey following these steps:
- Create categories based on different software used for similar tasks.
- Present these categories in the questionnaire with well-known examples.
- Explain each scale with a brief sentence.
- To evaluate importance, build a 7-point Likert scale ranging from -3 (very unimportant) to 3 (very important).
To compare our results with the initial paper, we also included scales similar to our new categories. For ‘Dashboard’, the most similar scale is ‘Learning Platforms’, and for ‘VR’, it is ‘Games’.
A total of 69 people participated in our survey, out of which 42 completed it. The majority of participants were researchers, technical staff, or students.
The correlation analysis showed that there was a significant relationship between ‘Dashboard’ and ‘Learning Platform’. The correlation between ‘Games’ and ‘VR’ was strong.
For more details, see our rejected paper.
Critics from peer review
The paper was submitted to the MuC 2023 and was rejected. The most critical points are:
- It was not evident why VR and Dashboard were proposed together.
- Why the need for Dashboard and VR UEQ+ modules, if existing modules on Games and Learning already share much overlap?
- The sample size and the method how we construct the scales was criticised.